You are browsing the archive for visualization.

What’s new in Head Start?

- April 29, 2014 in Panton Fellowships

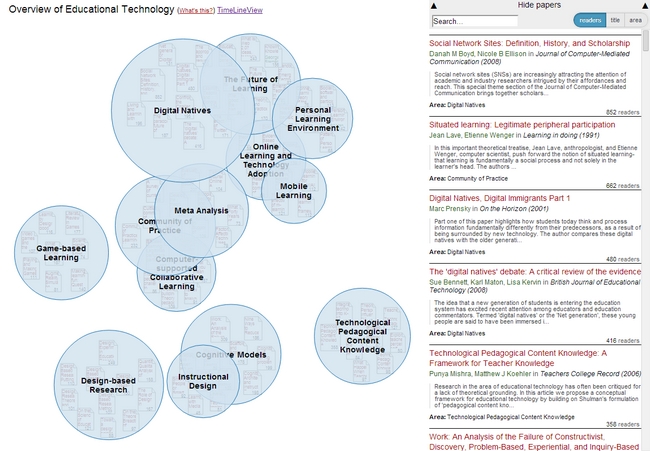
The past couple of months I have been working on the open source visualization Head Start in the context of my research stay at University of Pittsburgh. Head Start is intended for scholars who want to get an overview of a research field. They could be young PhDs getting into a new field, or established scholars who venture into a neighboring field. The idea is that you can see the main areas and papers in a field at a glance without having to do weeks of searching and reading. You can find more information in my last blog post on the system.

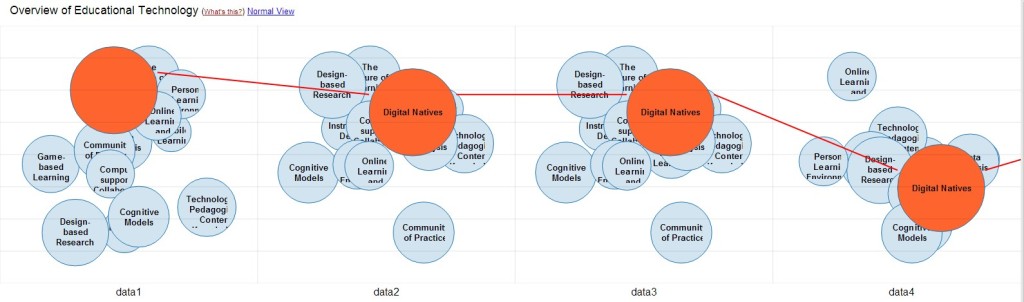
If you read this post, you already know that Philipp Weißensteiner introduced a timeline visualization to the repository that lets you compare different datasets in a single view. I finished the integration of the timeline visualization, making it possible to review all datasets both in the regular and the timeline view. I was also busy consolidating the code and fixing the occassional bug along the way. The biggest change in version 2.5, however, is the introduction of a server component to Head Start. So far, Head Start consisted of a pre-processing system for generating the data, and an HTML5 interface for visualizing the data. There was no way of manipulating the visualization after it had been loaded. The new server component consists of REST-ful webservices and a PHP backend to deal with dynamic requests.

Adaptive features of Head Start

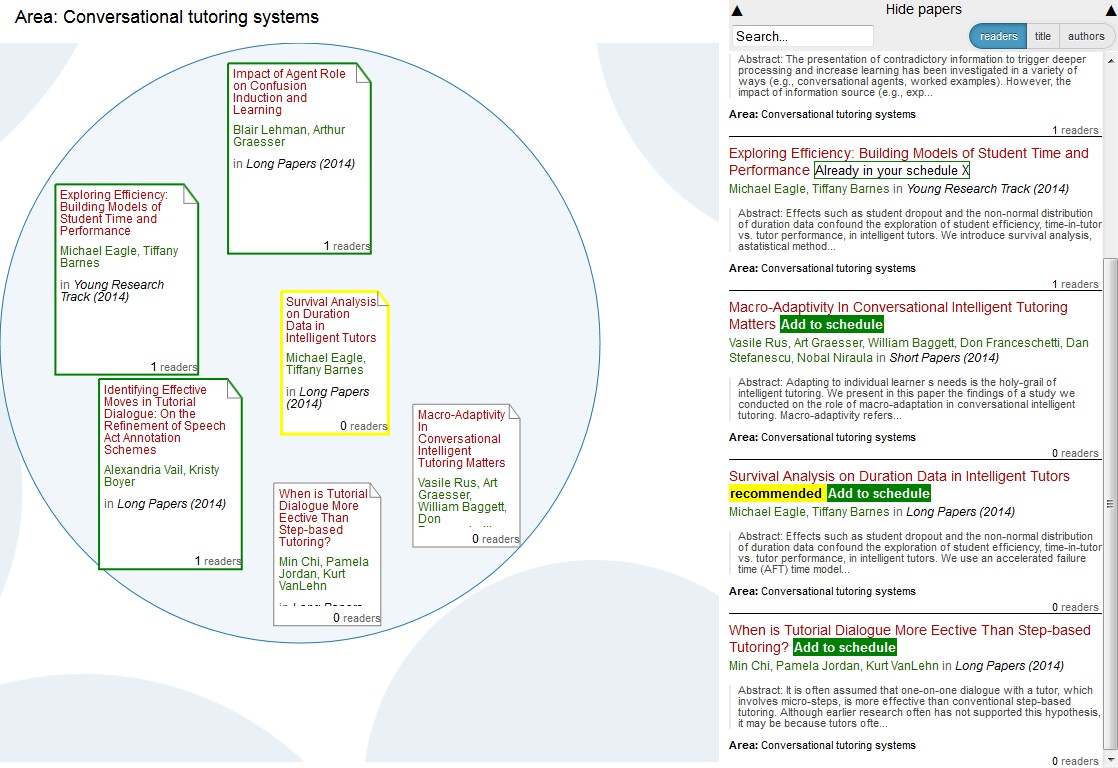
The server component proved very useful during the integration of Head Start with Conference Navigator 3, developed  by the great folks of the PAWS Lab here in Pittsburgh. Conference Navigator is a nifty scheduling system that allows you to create a personal conference schedule by bookmarking talks from the program. The system then gives you recommendations for further talks based on your choices. Head Start will be used as an alternate way of looking at the topics of the conference, and to give better context to the talks that you already selected and the talks that are recommended for you. To do that, Head Start dynamically loads bookmarking and recommendation data from the CN3 database.

What’s next? First of all, the system will be evaluated with users in one of the upcoming conferences that Conference Navigator supports. Furthermore, I would like to move the preprocessing systems from an offline to an online solution, thus enabling it to load live content from APIs.

If any of the above got you interested, here is the link to the Github repository.  As always, please get in touch if you have any questions or comments, or in case you want to collaborate on this project.


Second Quarterly Report on my Panton Fellowship

- March 26, 2014 in Panton Fellowships

by Timothy Appnel

by Timothy Appnel

I am now almost halfway through my Panton Fellowship, so it is time to sum up my activities once again.

The most important activity in the last quarter was surely the work on the open source visualization Head Start. Head Start is intended to give scholars an overview of a research field. You can find out all about the initial release in this blog post. I was busy in the last few weeks with bugfixing and stability improvements. I also refactored the whole pre-processing system and further integrated the work of Philipp Weißensteiner with regards to time-series visualization. If you are interested in trying out Head Start, or – even better – would like to contribute to its development, check out the Github repository.

Furthermore, I attended the Science Online un-conference in Raleigh (February 27 to March 1). Scio14 was very inspiring and engaging. Cameron Neylon hosted a great session on imagining the far future of academic publishing. In Rachel Levy‘s workshop on visualizations, we reflected on our own visualizations and there were tons of tips for improving one’s work. Other great sessions included post-publication peer review (with Ivan Oransky), altmetrics (facilitated by Cesar Berrios-Otero), and alternate careers in science (led by Eva Amsen). I also encourage you to check out the videos of the keynotes which include a very inspiring talk by Rebecca Tripp and Meg Lowman on neglected audiences in science, and the awesone crowd-sourced 3D printing project for creating prosthetic hands by Nick Parker and Jon Schull.

Let’s move on to my work for the local Austrian community. Together with my fellow OKFN members Sylvia Petrovic-Majer, Stefan Kasberger, and Christopher Kittel, I became active (remotely for now) in the Open Access Network Austria (OANA). Specifically, I am contributing to the working group “Involvment of researchers in open access”. I am very excited about this opportunity as it is one of the objectives of my Panton Fellowship to draw more researchers in open science.

What else? Earlier this year, I was interviewed for the openscienceASAP podcast. In the interview, I talked about altmetrics, the need for an inclusive approach to open science, and the Panton Fellowships. You can find the podcast here (in German). If you have read my last report, you may remember that I spoke on a panel about open science at University of Graz. The video of the panel (in German) is now online and can be found here. Furthermore, I’d like to draw your attention to the monthly sum-ups of open science activities in the German speaking world and beyond: January, February.

So what will my next quarter look like? As you may remember from my last report, I am currently a visiting scholar at University of Pittsburgh. In the weeks to come, I will integrate Head Start with Conference Navigator 3, developed  by the great folks of the PAWS Lab here in Pittsburgh. Conference Navigator is a nifty scheduling system that allows you to create a personal conference schedule by bookmarking talks from the program. The system then gives you recommendations for further talks based on your choices. Head Start will be used as an alternate way of looking at the topics of the conference, and to give better context to the talks that you already selected. I will return to Austria in June, just in time for Peter Murray-Rust‘s visit to Vienna. There are already a lot of activities planned around his stay, and I am very much looking forward to that. As always, please get in touch if you have any questions or comments, or in case you want to collaborate on one or the other project.

New version of open source visualization Head Start released

- February 24, 2014 in Panton Fellowships

In July last year, I released the first version of a knowledge domain visualization called Head Start. Head Start is intended for scholars who want to get an overview of a research field. They could be young PhDs getting into a new field, or established scholars who venture into a neighboring field. The idea is that you can see the main areas and papers in a field at a glance without having to do weeks of searching and reading.

Interface of Head Start

Interface of Head Start

You can find an application for the field of educational technology on Mendeley Labs. Papers are grouped by research area, and you can zoom into each area to see the individual papers’ metadata and a preview (or the full text in case of open access publications). The closer two areas are, the more related they are subject-wise. The prototye is based on readership data from the online reference management system Mendeley. The idea is that the more often two papers are read together, the closer they are subject-wise. More information on this approach can be found in my dissertation (see chapter 5), or if you like it a bit shorter, in this paper and in this paper.

Head Start is a web application built with D3.js. The first version worked very well in terms of user interaction, but it was a nightmare to extend and maintain. Luckily, Philipp Weißensteiner, a student at Graz University of Technology became interested in the project. Philipp worked on the visualization as part of his bachelor’s thesis at the Know-Center. Not only did he modularize the source code, he also introduced Javascript Finite State Machine that lets you easily describe different states of the visualization. To setup a new instance of Head Start is now only a matter of a couple of lines. Philipp developed a cool proof of concept for his approach: a visualization that shows the evolution of a research field over time using small multiples. You can find his excellent bachelor’s thesis in the repository (German).

Head Start Timeline View

Head Start Timeline View

In addition, I cleaned up the pre-processing scripts that do all the clustering, ordination and naming. The only thing that you need to get started is a list of publications and their metadata as well as a file containing similarity values between papers. Originally, the similarity values were based on readership co-occurrence, but there are many other measures that you can use (e.g. the number of keywords or tags that two papers have in common).

So without further ado, here is the link to the Github repository. Any questions or comments, please send them to me or leave a comment below.