Congratulations to the Panton Fellows 2013-2014
Jenny Molloy - November 20, 2014 in Featured, Panton Fellowships
Samuel Moore, Rosie Graves and Peter Kraker are the 2013-2014 Open Knowledge Panton Fellows – tasked with experimenting, exploring and promoting open practises through their research over the last twelve months. They just posted their final reports so we’d like to heartily congratulate them on an excellent job and summarise their highlights for the Open Knowledge community.
Over the last two years the Panton Fellowships have supported five early career researchers to further the aims of the Panton Principles for Open Data in Science alongside their day to day research. The provision of additional funding goes some way towards this aim, but a key benefit of the programme is boosting the visibility of the Fellow’s work within the open community and introducing them to like-minded researchers and others within the Open Knowledge network.
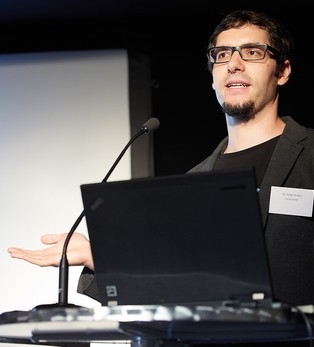
On stage at the Open Science Panel Vienna (Photo by FWF/APA-Fotoservice/Thomas Preiss)
Peter Kraker (full report) is a postdoctoral researcher at the Know-Center in Graz and focused his fellowship work on two facets: open and transparent altmetrics and the promotion of open science in Austria and beyond. During his Fellowship Peter released the open source visualization Head Start, which gives scholars an overview of a research field based on relational information derived from altmetrics. Head Start continues to grow in functionality, has been incorporated into Open Knowledge Labs and is soon to be made available on a dedicated website funded by the fellowship.
Peter’s ultimate goal is to have an environment where everybody can create their own maps based on open knowledge and share them with the world. You are encouraged to contribute! In addition Peter has been highly active promoting open science, open access, altmetrics and reproducibility in Austria and beyond through events, presentations and prolific blogging, resulting in some great discussions generated on social media. He has also contributed to a German summary of open science activities every month and is currently involved in kick-starting a German-speaking open science group through the Austrian and German Open Knowledge local groups.

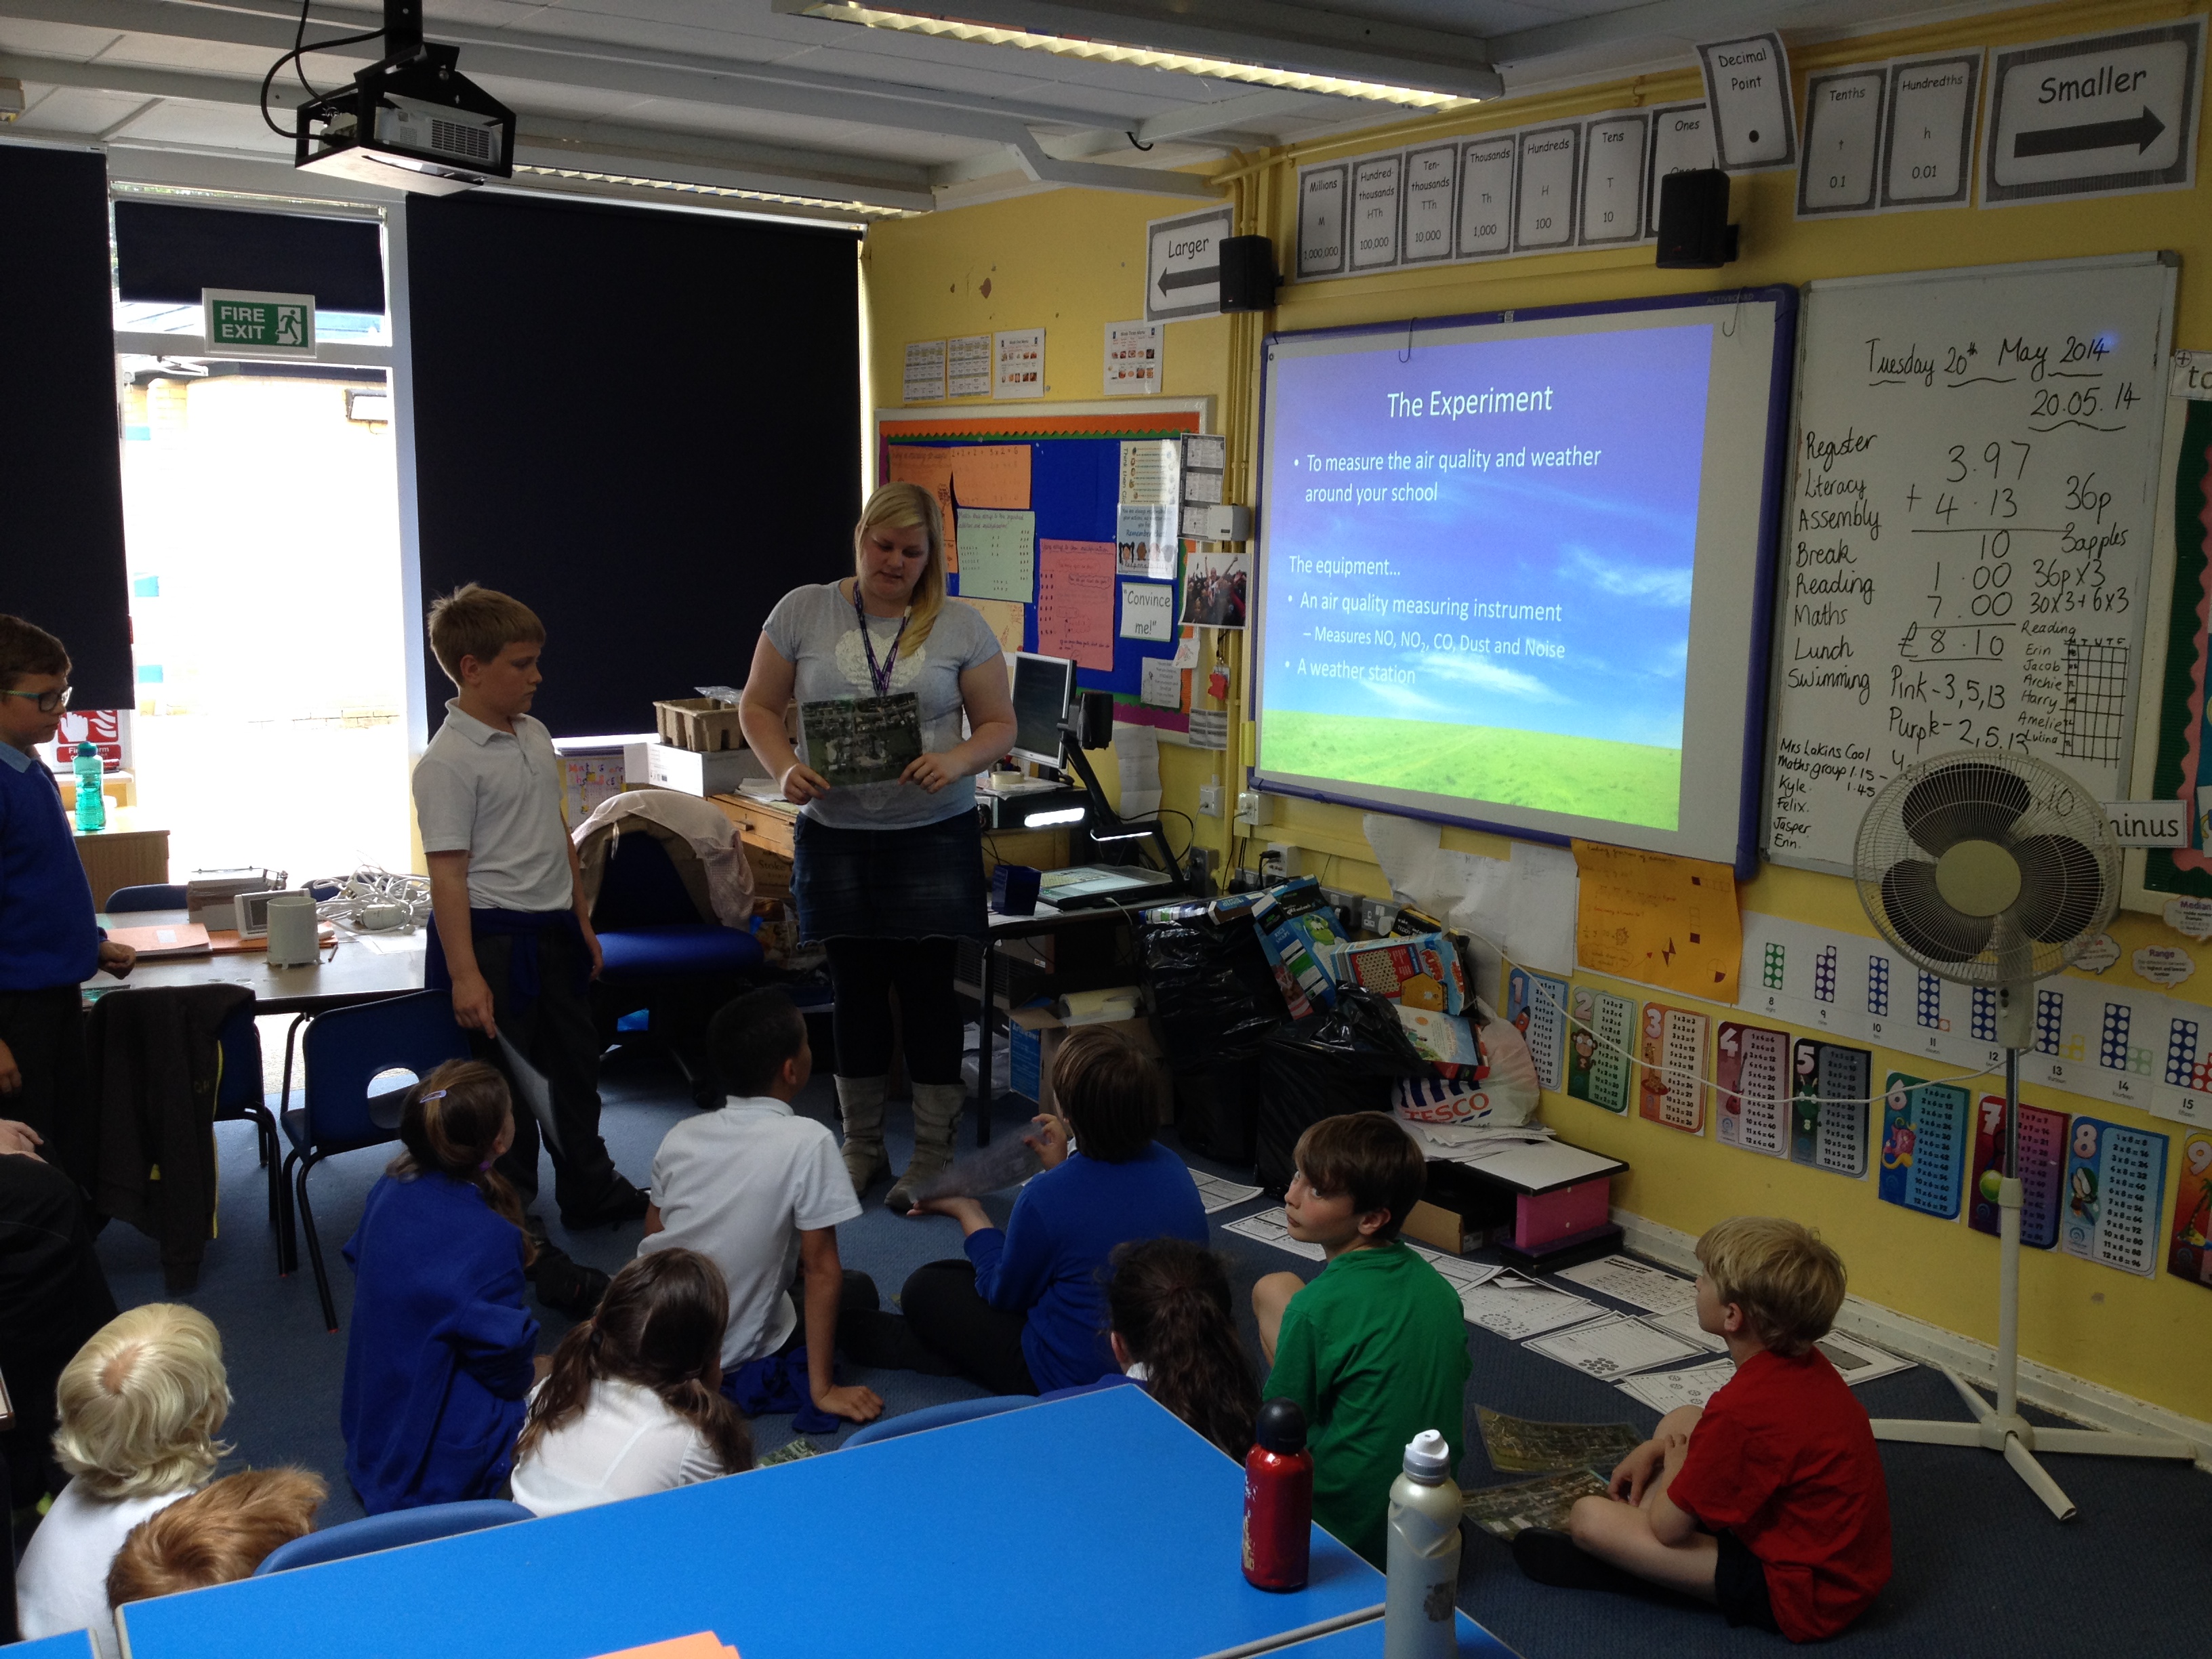
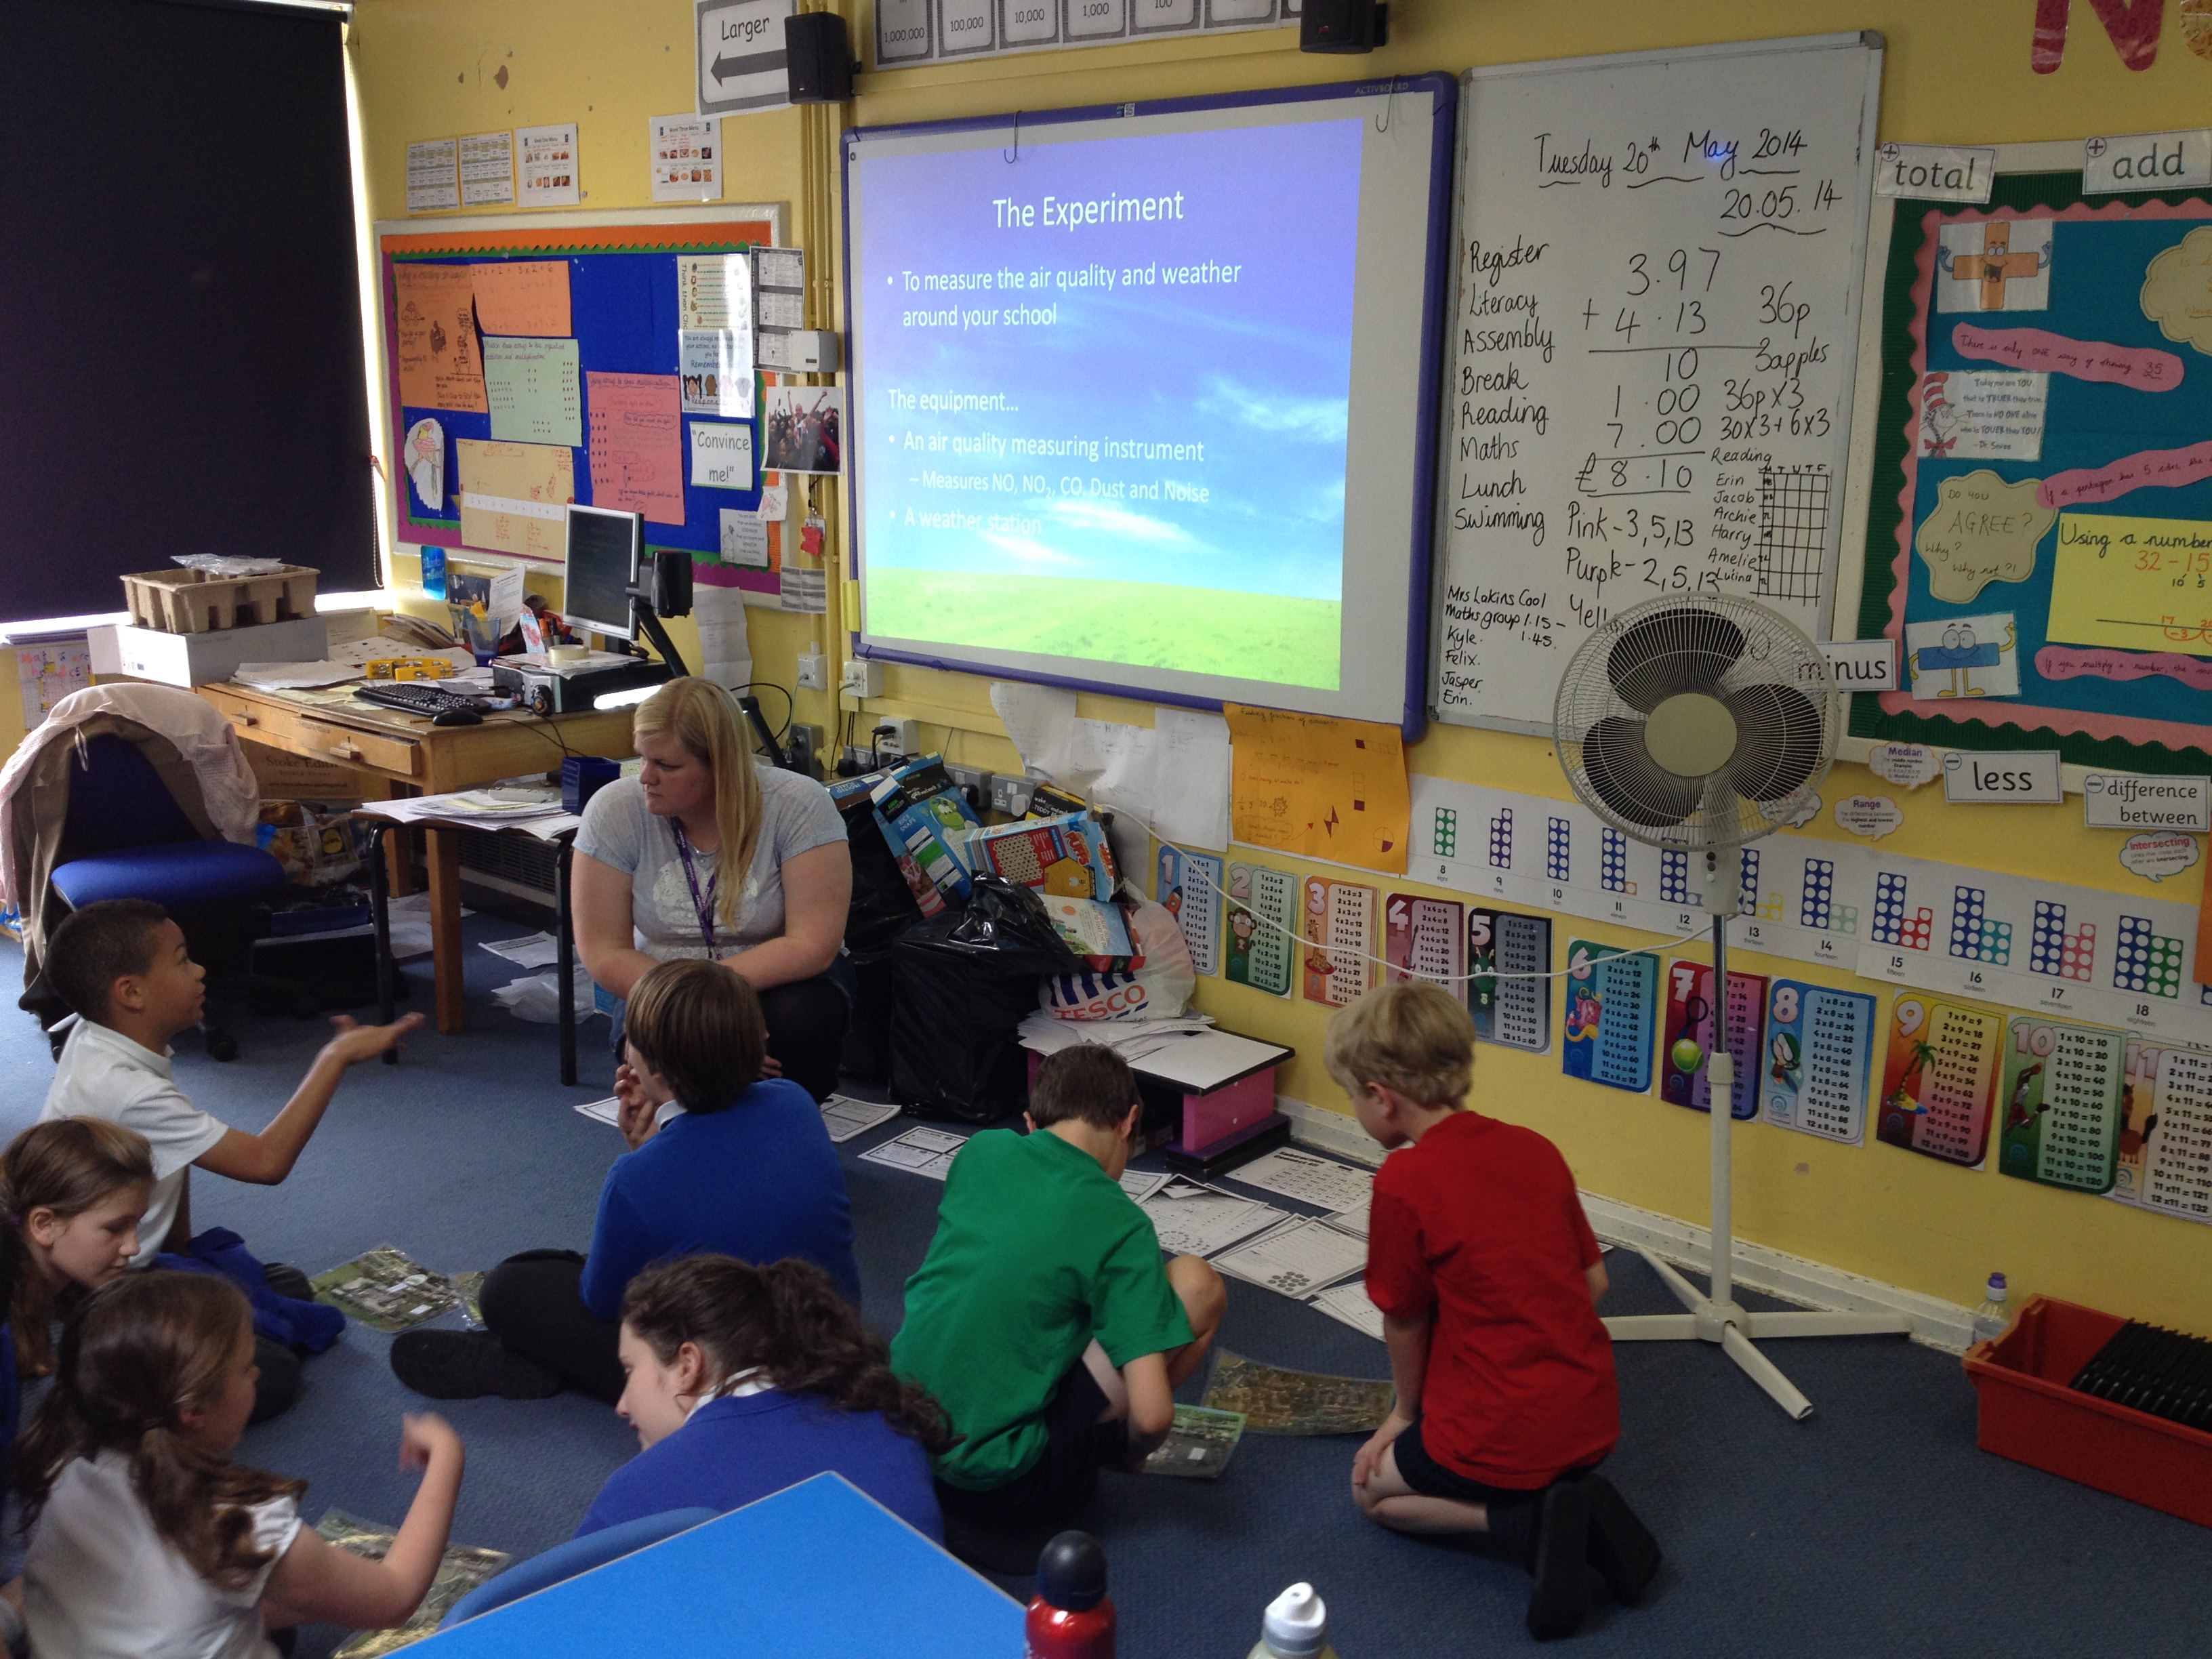
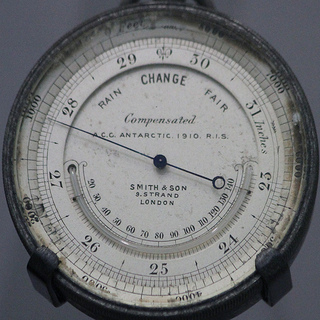
Rosie with an air quality monitor
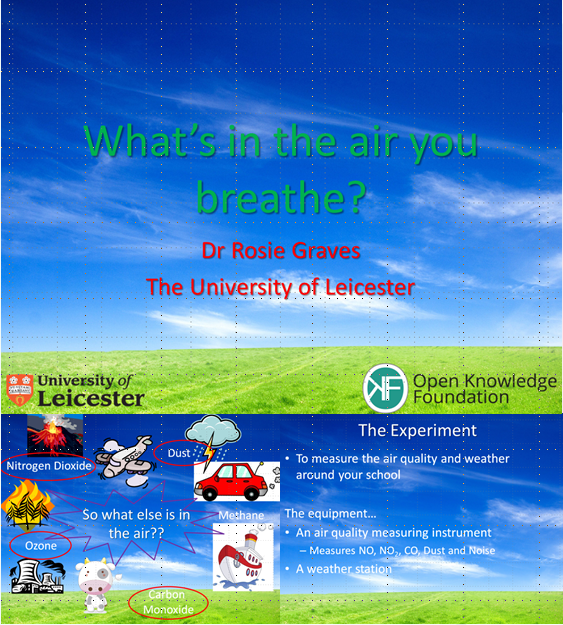
Rosie Graves (full report) is a postdoctoral researcher at the University of Leicester and used her fellowship to develop an air quality sensing project in a primary school. This wasn’t always an easy ride, the sensor was successfully installed and an enthusiastic set of schoolhildren were on board, but a technical issue meant that data collection was cut short, so Rosie plans to resume in the New Year. Further collaborations on crowdsourcing and school involvement in atmospheric science were even more successful, including a pilot rain gauge measurement project and development of a cheap, open source air quality sensor which is sure to be of interest to other scientists around the Open Knowledge network and beyond. Rosie has enjoyed her Panton Fellowship year and was grateful for the support to pursue outreach and educational work:
“This fellowship has been a great opportunity for me to kick start a citizen science project … It also allowed me to attend conferences to discuss open data in air quality which received positive feedback from many colleagues.”

Samuel Moore (full report) is a doctoral researcher in the Centre for e-Research at King’s College London and successfully commissioned, crowdfunded and (nearly) published an open access book on open research data during his Panton Year: Issues in Open Research Data. The book is still in production but publication is due during November and we encourage everyone to take a look. This was a step towards addressing Sam’s assessment of the nascent state of open data in the humanities:
“The crucial thing now is to continue to reach out to the average researcher, highlighting the benefits that open data offers and ensuring that there is a stock of accessible resources offering practical advice to researchers on how to share their data.”
Another initiative Sam initiated during the fellowship was establishing the forthcoming Journal of Open Humanities Data with Ubiquity Press, which aims to incentivise data sharing through publication credit, which in turn makes data citable through usual academic paper citation practices. Ultimately the journal will help researchers share their data, recommending repositories and best practices in the field, and will also help them track the impact of their data through citations and altmetrics.
We believe it is vital to provide early career researchers with support to try new open approaches to scholarship and hope other organisations will take similar concrete steps to demonstrate the benefits and challenges of open science through positive action.
Finally, we’d like to thank the Computer and Communications Industry Association (CCIA) for their generosity in funding the 2013-14 Panton Fellowships.