Open and transparent altmetrics for discovery
Peter Kraker - December 9, 2013 in Panton Fellowships, Research, Tools
by AG Cann
Altmetrics are a hot topic in scientific community right now. Classic citation-based indicators such as the impact factor are amended by alternative metrics generated from online platforms. Usage statistics (downloads, readership) are often employed, but links, likes and shares on the web and in social media are considered as well. The altmetrics promise, as laid out in the excellent manifesto, is that they assess impact quicker and on a broader scale.
The main focus of altmetrics at the moment is evaluation of scientific output. Examples are the article-level metrics in PLOS journals, and the Altmetric donut. ImpactStory has a slightly different focus, as it aims to evaluate the oeuvre of an author rather than an individual paper.
This is all good and well, but in my opinion, altmetrics have a huge potential for discovery that goes beyond rankings of top papers and researchers. A potential that is largely untapped so far.
How so? To answer this question, it is helpful to shed a little light on the history of citation indices.
Pathways through science
In 1955, Eugene Garfield created the Science Citation Index (SCI) which later went on to become the Web of Knowledge. His initial idea – next to measuring impact – was to record citations in a large index to create pathways through science. Thus one can link papers that are not linked by shared keywords. It makes a lot of sense: you can talk about the same thing using totally different terminology, especially when you are not in the same field. Furthermore, terminology has proven to be very fluent even in the same domain (Leydesdorff 1997). In 1973, Small and Marshakova realized – independently from each other – that co-citation is a measure of subject similarity and therefore can be used to map a scientific field.
Due to the fact that citations are considerably delayed, however, co-citation maps are often a look into the past and not a timely overview of a scientific field.
Altmetrics for discovery
In come altmetrics. Similarly to citations, they can create pathways through science. After all, a citation is nothing else but a link to another paper. With altmetrics, it is not so much which papers are often referenced together, but rather which papers are often accessed, read, or linked together. The main advantage of altmetrics, as with impact, is that they are much earlier available.
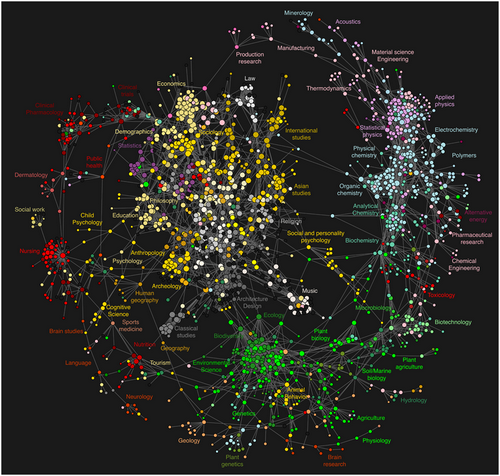
Bollen et al. (2009): Clickstream Data Yields High-Resolution Maps of Science. PLOS One. DOI: 10.1371/journal.pone.0004803.
One of the efforts in this direction is the work of Bollen et al. (2009) on click-streams. Using the sequences of clicks to different journals, they create a map of science (see above).
In my PhD, I looked at the potential of readership statistics for knowledge domain visualizations. It turns out that co-readership is a good indicator for subject similarity. This allowed me to visualize the field of educational technology based on Mendeley readership data (see below). You can find the web visualization called Head Start here and the code here (username: anonymous, leave password blank).
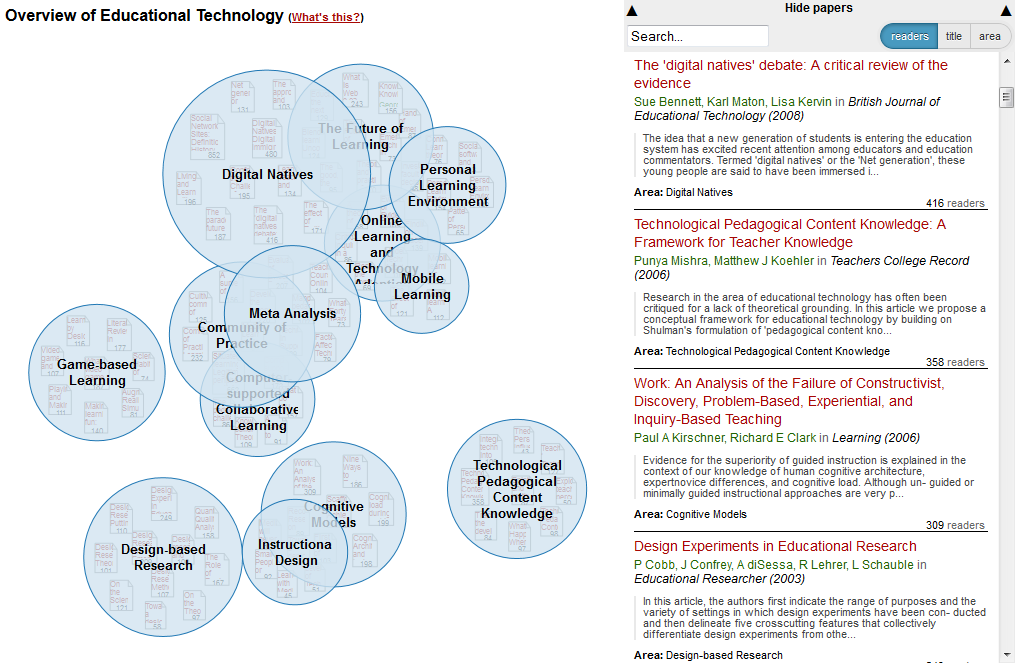
http://labs.mendeley.com/headstart
Why we need open and transparent altmetrics
The evaluation of Head Start showed that the overview is indeed more timely than maps based on citations. It, however, also provided further evidence that altmetrics are prone to sample biases. In the visualization of educational technology, the computer science driven areas such as adaptive hypermedia are largely missing. Bollen and Van de Sompel (2008) reported the same problem when they compared rankings based on usage data to rankings based on the impact factor.
It is therefore important that altmetrics are transparent and reproducible, and that the underlying data is openly available. This is the only way to ensure that all possible biases can be understood.
As part of my Panton Fellowship, I will try to find datasets that satisfy these criteria. There are several examples of open bibliometric data, such as the Mendeley API, and figshare API that have adopted CC BY, but most of the usage data is not available publicly or cannot be redistributed. In my fellowship, I want to evaluate the goodness of fit of different open altmetrics data. Furthermore, I plan to create more knowledge domain visualizations such as the one above.
So if you know any good datasets please leave a comment below. Of course any other comments on the idea are much appreciated as well.