New version of open source visualization Head Start released
Peter Kraker - February 24, 2014 in Panton Fellowships
In July last year, I released the first version of a knowledge domain visualization called Head Start. Head Start is intended for scholars who want to get an overview of a research field. They could be young PhDs getting into a new field, or established scholars who venture into a neighboring field. The idea is that you can see the main areas and papers in a field at a glance without having to do weeks of searching and reading.
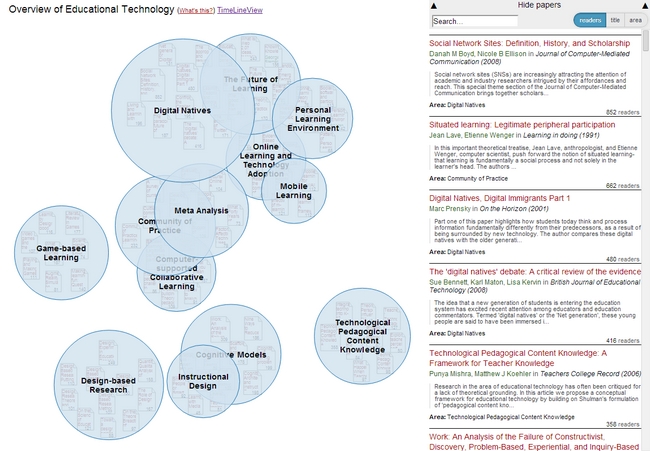
Interface of Head Start
You can find an application for the field of educational technology on Mendeley Labs. Papers are grouped by research area, and you can zoom into each area to see the individual papers’ metadata and a preview (or the full text in case of open access publications). The closer two areas are, the more related they are subject-wise. The prototye is based on readership data from the online reference management system Mendeley. The idea is that the more often two papers are read together, the closer they are subject-wise. More information on this approach can be found in my dissertation (see chapter 5), or if you like it a bit shorter, in this paper and in this paper.
Head Start is a web application built with D3.js. The first version worked very well in terms of user interaction, but it was a nightmare to extend and maintain. Luckily, Philipp Weißensteiner, a student at Graz University of Technology became interested in the project. Philipp worked on the visualization as part of his bachelor’s thesis at the Know-Center. Not only did he modularize the source code, he also introduced Javascript Finite State Machine that lets you easily describe different states of the visualization. To setup a new instance of Head Start is now only a matter of a couple of lines. Philipp developed a cool proof of concept for his approach: a visualization that shows the evolution of a research field over time using small multiples. You can find his excellent bachelor’s thesis in the repository (German).
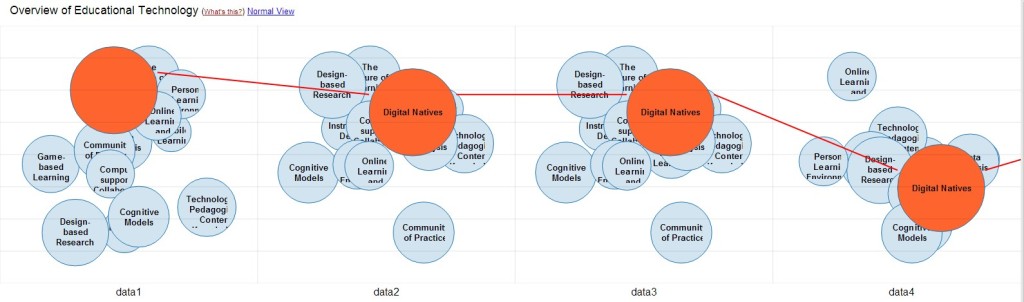
Head Start Timeline View
In addition, I cleaned up the pre-processing scripts that do all the clustering, ordination and naming. The only thing that you need to get started is a list of publications and their metadata as well as a file containing similarity values between papers. Originally, the similarity values were based on readership co-occurrence, but there are many other measures that you can use (e.g. the number of keywords or tags that two papers have in common).
So without further ado, here is the link to the Github repository. Any questions or comments, please send them to me or leave a comment below.